April 24, 2015
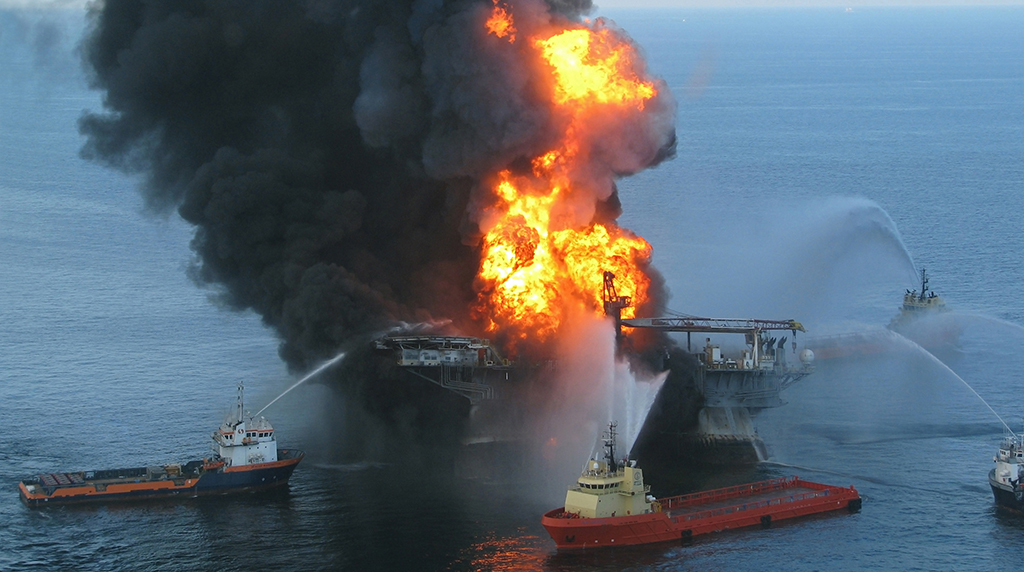
Five years ago today, on April 20th 2010, a chain of events that ultimately resulted in the most significant offshore oil release in U.S. history began. The Deepwater Horizon, a dynamically positioned offshore mobile drilling unit, was drilling a production well in the Macondo Prospect, located in Mississippi Canyon lease block 252, about 40 miles offshore if the southeast coast of Louisiana. The night of April 20th 2010, rig operators experienced a loss of well control, resulting in a well blowout. The explosion and subsequent fire on the platform killed eleven men and injured sixteen others. The blowout preventer, which should have cut the riser pipe at the seafloor and sealed the blown out well, failed and the fire on the platform raged for two days. On April 22nd, the Deepwater Horizon sank, initiating an uncontrolled release of oil and gas from the seafloor that lasted for 87 days and introduced over some 5 million barrels of oil (210 million gallons) and 500,000 metric tons of methane into the Gulf of Mexico ecosystem.
Scientists in the “Ecosystem Impacts of Oil and Gas Inputs to the Gulf” research consortium, ECOGIG for short, were first responders to the Macondo blowout and continue to monitor the health of the Gulf ecosystem, track the long term impacts of and recovery from the Macondo Blowout, and study natural hydrocarbon seeps to better understand the factors that regulate oil and gas consumption by Gulf microbial communities. To remember the events of five years ago and to pay tribute to the 11 men who died and their families, we will be posting several news stories this week. The first post describes the role of ECOGIG scientists in the initial response to the Macondo Blowout. The second post describes what ECOGIG scientists have learned in the past five years, in their own words. And the third post describes how the ECOGIG program has impacted the young scientists in training, both graduate students and undergraduates, who play a critical role in the ECOGIG program and who will be the “first responders” in the future.
Part 1. The role of ECOGIG scientists in Deepwater Horizon science – response to recovery
 Mandy Joye (University of Georgia, ECOGIG program director): April 20th, 2010 began as an ordinary day. Most of us spent that day in our offices, teaching our classes, talking to our students and colleagues, and working on various papers or proposals. We settled in for the night not realizing the horror was unfolding in the Gulf of Mexico. We did not yet know that around 10PM, the Deepwater Horizon offshore drilling unit experienced a devastating uncontrolled blowout while drilling a production well at the Macondo prospect in Mississippi Canyon Block 252 (MC252). Eleven fine men died from the initial explosion, and many more were injured, some severely. Beginning with a horrible human tragedy, the 87-day long uncontrolled blowout led to a massive hydrocarbon injection into Gulf waters and an unprecedented application of chemical dispersants both to the surface ocean and at the seabed. This massive perturbation rocked the Gulf system and many ECOGIG scientists were the first academic responders. Even early on in the chain of events, it is fair to say that none of us realized the extent to which this infamous day would affect us personally and alter the course of our careers.
On April 21st, Carol Lutken from the University of Mississippi was at sea on the R/V Pelican leading a research expedition to Mississippi Canyon block 118 (MC118). Carol sent out an email informing those of us involved in a long term monitoring program at MC118 that there was clearly a significant incident going on nearby (she could see a massive cloud of smoke and vessel traffic was heavy, all heading towards at MC252. Soon they had to clear the area (by order of the US Coast Guard). I immediately began scouring the internet for information and found it, ultimately, on a website maintained by Sabine Parrish (TX). On April 22nd, more information was becoming available because the drilling platform had sunk. The situation was dire and I emailed Dr. Ray Highsmith, then director of the National Institute for Undersea Science at the University of Mississippi. Ray was the Program Manager for the MC118 Gas Hydrate Microbial Observatory program, which was funded by NOAA, and included many soon-to-be ECOGIG researchers. My question to Ray was something along the lines of ‘shouldn’t we think about getting a ship out there? We have so much experience in the area and background data from MC118, we can help’. Ray had been involved very actively in the Exxon Valdez response and was already thinking the same thing. From that, the idea to launch the first academic response cruise to examine the impacts of the Deepwater Horizon(DWH)/Macondo Blowout was born.
A unique thing about the ECOGIG group is our rich history of successful collaboration. Many members of the ECOGIG team had been collaborating for 15 years or more through National Science Foundation, Minerals Management Service, National Institute for Undersea Science and Technology, and Department of Energy funded efforts. We knew each other and we knew what each of us brought to the table; we knew who to ask for help when we need it; and, importantly, we trusted each other. We are friends as well as colleagues, meaning we have excellent lines of communication. Above all, we respect each other and we were all working towards the same goal: gathering data to help aid the response, to document unexpected phenomena, and to serve in restoration of the Gulf ecosystem, which we all care deeply about. Combining forces to collectively respond to the DWH response was natural for us. And our response work later gave birth to the ECOGIG consortium, through which we continue our work today.
ECOGIG “first responders”: from the deep sea to the sea surface and back
The first academic response research cruise
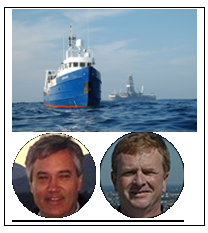
R/V Pelican Cruise, 2-16 May 2010, Dr. Mandy Joye: The cruise to the DWH incident arena was led by ECOGIG co-PIs Drs. Vernon Asper and Arne Diercks (shown below, L to R), from the University of Southern Mississippi. The goals of the R/V Pelican cruise were to collect as many sediment cores as possible from a large area all around the Macondo wellhead (so that we would have some background data near the wellhead) and to determine whether there were deepwater plumes enriched in oil and gas, which we anticipated there would be. Preparing for this cruise was like no other, we had literally days to stage the cruise and all of the science party, as well as the ship’s crew were required to under go “HAZWOPER” training so that they were prepared to work under the extremely hazardous conditions out on the water near the wellhead. Thick, dark brown oil slicks were abundant (right) and in other places, it was rainbow sheen or a gray-colored metallic sheen; oil was seemingly everywhere. After spending a week collecting sediment cores, the science party turned its attention to searching for the deepwater plume. This turned out to be an incredible challenge since the plume was literally invisible, lurking some 1100m below the surface and some 400m above the bottom. But through some very clever thinking and engineering, 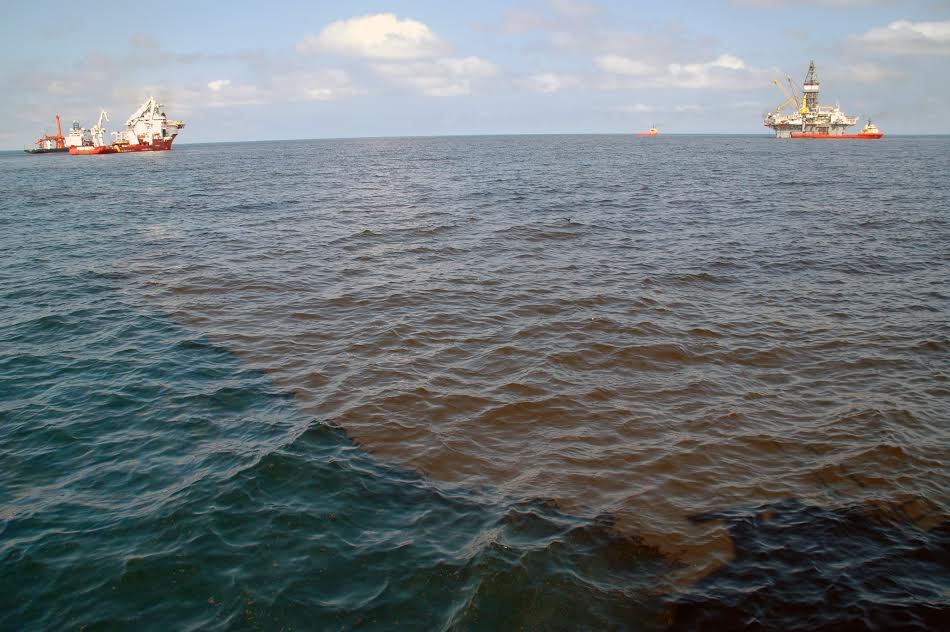 Arne and Vernon located the plume and collected the first samples from the deepwater plume; these samples showed elevated levels of oil and gas. They reported these incredible findings to NOAA and The New York Times and Nature picked up the story. The next response cruise was tasked with characterizing the plume to a greater degree but before that, there was the issue of the discharge rate. Image (right) shows a thick oil slick about 5 miles from the Macondo wellhead in May 2010,. (Photo credit Luke McKay, UNC-CH.)
The flow rate debate
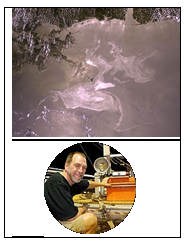
Florida State University Professor and ECOGIG co-PI Dr. Ian MacDonald helped quantify the rate of hydrocarbon discharge from the Macondo wellhead from the very beginning.
Dr. Ian MacDonald: The first satellite images of the spreading oil slick caused by the broken well were acquired on 24 April, less than four days after the Deepwater Horizon sank. More images were acquired during the following days. The image pictured left is from a later stage of the event, towards the end of May, but shows how NASA's MODIS satellite images oil on the sea surface. This surveillance was combined with extensive airborne reconnaissance. On 25 April, the authorities reversed an earlier statement that no oil was escaping from the wreckage of the well and released estimates that rate of discharge was as high as 1000 barrels (160 m3) per day. Based on review of the satellite and aerial data, I estimated that the actual rate was at least 26,500 barrels per day and gave media interviews attesting this. The authorities increased the official estimate to 5000 barrels per day on 28 April, but there was strong resistance to verifying or determining the flow rate. Admiral Thad Allen, the on-scene commander, and others repeatedly stated that techniques to measure the rate of the flow were an impediment to the response effort and irrelevant because the response was already at full capacity.
I thought then and continue to believe that accurate discharge rates from an oil spill are essential for assessing the scale of the problem and to progressively measure the effectiveness of response efforts. The media were eager to hear a point of view that better conformed to the gathering body of evidence, which indicated a dire spread of pollution. I gave many interviews stating my concerns and for a time, my initial flow-rate was used daily in the New York Times as the “MacDonald Minimum” for computing the ever-increasing total discharge.
This was a most anxious time from me, because events on the seafloor remained shrouded in secrecy. BP would not release video from the remotely operated vehicles (ROVs) tending to the wreckage and the Coast Guard would not compel them to do so. Without video of the escaping plumes, there could be no more definite confirmation of the rate. NOAA officials stated that video would be unhelpful because flow-rates could not be estimated from video. It took the threat of a congressional subpoena from Massachusetts Congressman Markey to finally force the release of less than 30 sec of video showing oil gushing from the end of a broken pipe. In a remarkable sequence of events, Richard Harris from National Public Radio shared the video with experts from three different academic institutions. Overnight, they independently produced estimates of 50,000 to 70,000 barrels of oil per day. The terms of the debate swung decisively and the government began moving toward a technical assessment of the discharge rates. On 2 August, more than two weeks after the well had been plugged, the government’s Flow Rate Technical Group confirmed an official rate of 58,000 barrels per day.
In my view, the resistance to flow rate estimation was a fundamental flaw in the response. The lesson has hopefully been learned that data and scientific analysis are essential to emergency response. Often these data and the ability to analyze them lie with the scientific community within academia.
The second academic response cruise
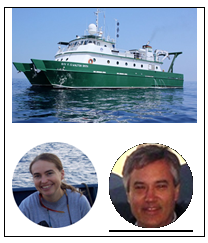
R/V Walton Smith cruise, 25 May-6 June, 2010. Dr. Mandy Joye:
The second response cruise to the Macondo blowout area was led by ECOGIG director Dr. Mandy Joye and was funded by the National Science Foundation. ECOGIG co-PI Vernon Asper was also on board, as were a number of students and post-doctoral associates who ultimately became involved in the ECOGIG program. This cruise was tasked with further documenting the extent and impacts of deepwater plume: how much oil and gas were in the water? What impacts were these compounds having on the indigenous microbial community and its activity? How far did the plume extend and how was it behaving? We knew that the bathymetry (the topography of the seafloor) around the Macondo wellhead was complex (right figure) and we suspected that this complex bathymetry would impact the dynamics of the plume.
The figure (right) illustrates the complex topography on the seafloor in the vicinity of the Macondo wellhead. The red and green circles denote sampling locations during the Walton Smith cruise. The scale bar to the lower left is 10 km. (Image credit: Mandy Joye)
We were right about that: pinning down the location and dynamics of this plume was tough.
We occupied a series of stations all around the wellhead and to the southwest, which was the direction the currents were flowing and where we felt the plume would logically go, albeit through a somewhat winding and complicated route.
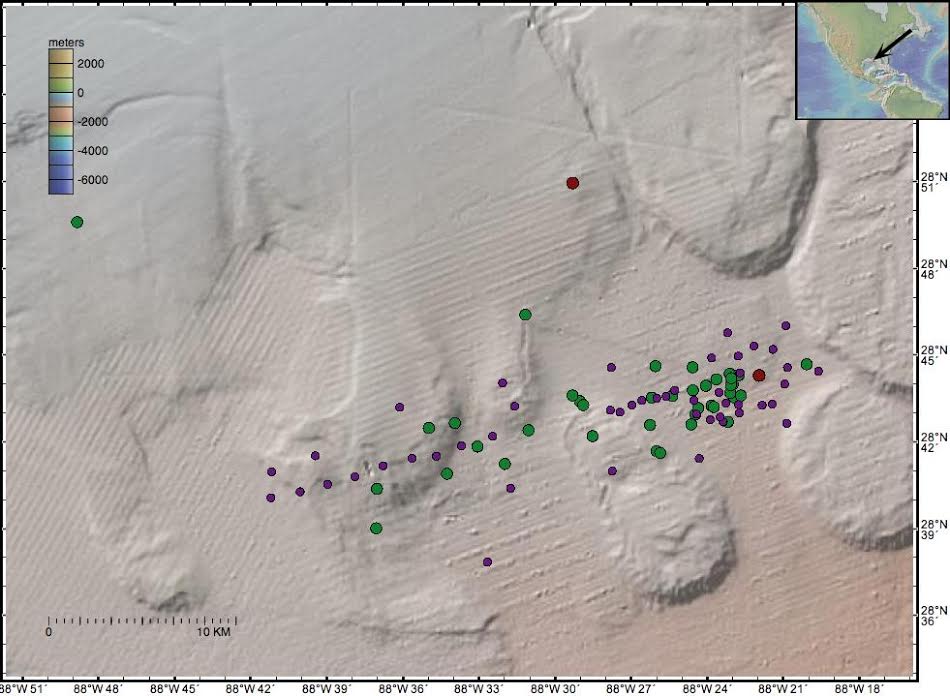
We sampled 90 stations on the Walton Smith cruise and one of the most amazing things was that stations 250m apart could be so different (green circles show areas of extreme hydrocarbon enrichment while purple circles showed less enrichment). The red circles show the Macondo wellhead (right side in the center of the sampling area) and MC118 above and to the west. We documented incredible enrichment of methane gas in the plume – up to 300 micromoles of methane per liter of water or some 10,000 times background concentrations at a natural hydrocarbon seep at a comparable depth. We later documented blooms of oil-eating bacteria in the hydrocarbon rich water and samples collected on this cruise were among the first to show the presence of dispersants lingering in the deepwater plume, flowing along with the hydrocarbon contaminated fluids.
The figure (right) illustrates profiles of oxygen (blue trace), chlorophyll a (green), colored dissolved organic matter (CDOM; red) and beam attenuation (black). The deepwater plume is evident in the elevated signals of CDOM and beam transmittance. (Image credit: Mandy Joye.)
But most importantly, this research cruise settled an important question once and for all: Did the deepwater plumes really exist? Yes, the plumes were real and they were important and they were unprecedented and we needed to track them so as to fully understand their impact on Gulf deepwater. The plumes were easily detected by tracking the abundance of colored dissolved organic matter (CDOM) – a proxy for oil – in the water column. In the figure to the right, the CDOM trace is red and the green trace is from the chlorophyll a sensor, which it turned out was pretty good at tracking polycyclic aromatic hydrocarbons (PAHs) as well. 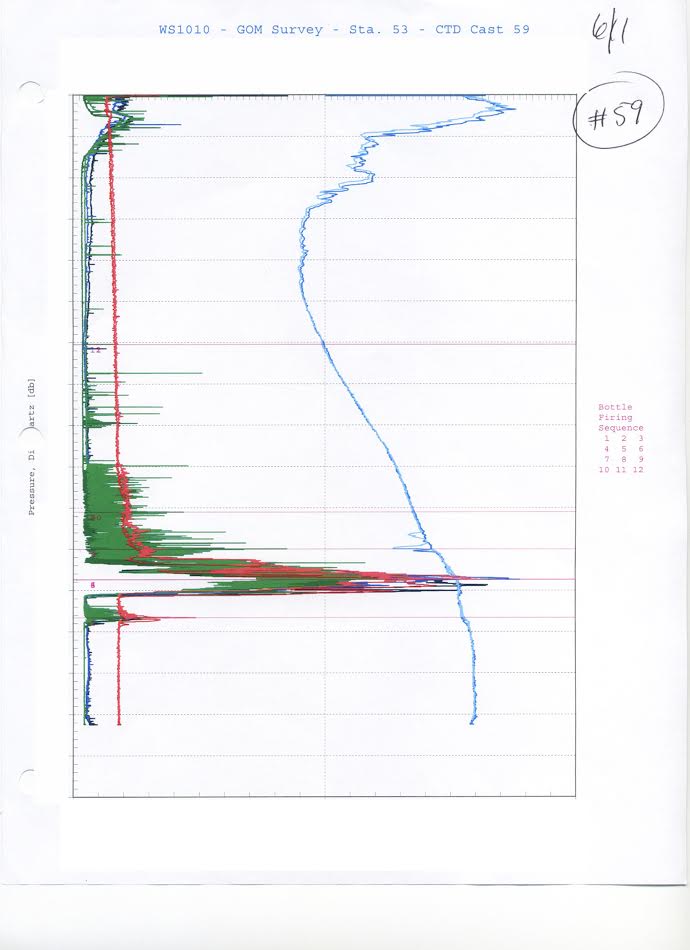
Data from this cruise were the first to show the rapid response of the microbial community to the oil and gas infusion – we documented the highest rates of water column aerobic methane oxidation ever observed in the pelagic ocean. We obtained samples from other scientists’ cruises between June and July 2010 to continue our time series of the microbiological and hydrocarbon dynamics of the deepwater plume. Then in August 2010, we were back out on the water.
Cold water coral assessment
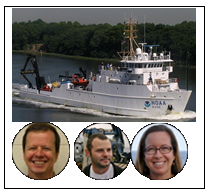
Dr. Erik Cordes: The NOAA Ship Nancy Foster / ROV Global Explorer Cruise, 21 – 29 July, 2010, was the first deep-water cruise for the Natural Resources Damage Assessment. This cruise was led by ECOGIG co-PI Chuck Fisher, with ECOGIG scientists Drs. Erik Cordes and Amanda Demopoulos on board. This cruise was tasked with taking the first look at the deep-water coral reefs of the Gulf to see if the Macondo discharge had affected these fragile coral sites. The cruise visited the Lophelia pertusa reefs of the Viosca Knolls region, only 20-25 nautical miles north of the Macondo well, and also the smaller coral sites on the western edge of the Mississippi Canyon. The scientific team examined many of the corals at these familiar sites, including re-imaging some down-looking photographic mosaic stations; developing a technique that would become a significant part of our work on future cruises. It was very difficult to assess the health of sites beyond their outward visual appearance using an ROV. Because most of the reef-forming corals consist of growing tips of coral on largely dead skeleton, there was no drastic visual evidence that they had been impacted by the spill. The other significant achievement of this cruise was to recover the sediment traps that had been placed at these sites as part of the MMS (now BOEM) and NOAA-OER funded “Lophelia II” research program, and place new traps out to continue our time series of sedimentation and particle flux to the deep seafloor that extended back and captured pre-discharge conditions.
Discovering sedimented oil
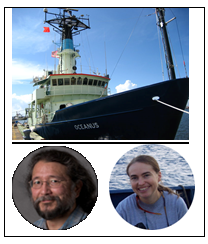
Dr. Mandy Joye: The R/V Oceanus cruise, 21 August to 20 September, 2010, was funded by the National Science Foundation. Originally aimed to study Trichodesmium dynamics in the Gulf, this cruise was repurposed to be a DWH oil spill response cruise. This cruise was led by ECOGIG co-PI Dr. Joseph Montoya and ECOGIG scientists Drs. Mandy Joye, Uta Passow, Vernon Asper, Arne Diercks, Ajit Subramaniam, Andy Juhl and Tracy Villareal were also on board. This cruise was full of some more “firsts” for the ECOGIG team. We deployed the first sediment trap near the wellhead to document the rates of oil sedimentation to the seafloor. We collected zooplankton samples to track the movement of hydrocarbons through the foodweb. And we collected sediment cores at some of the stations we sites that the Pelican team had sampled in 2010. We tried to find the deepwater plume and sample it but it has been dispersed throughout the water column and basically vanished. Only faint ghosts of the plume, apparent as small fluorescent or oxygen anomalies in the deepwater far to the southwest of the wellhead, were observed. The extremely high methane concentrations we had observed in May and June were now gone; though methane concentrations were still very slightly elevated, they were nothing like we observed in May/June 2010.
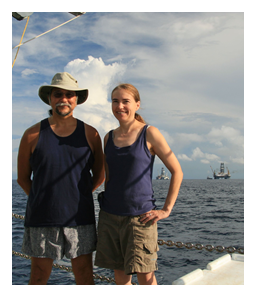 Right: Drs. Joe Montoya and Mandy Joye on the deck of the R/V Oceanus about 1.5 miles from the Macondo wellhead in August 2010. (Image credit: Ajit Subramaniam)
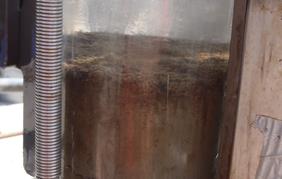
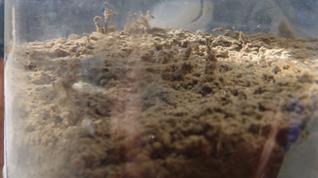
Perhaps the most unexpected discovery we made was the presence of highly weathered, recently sedimented oil on the seafloor. We collected cores in May from many of the same stations and saw no such layers, but we were not prepared for the thick (sometimes many cm) layers of freshly deposited material along the seabed we observed in August and September. These layers were observed many 10’s of miles from the wellhead, showing that “oil snow” deposition was a widespread phenomenon. The freshly deposited layer exhibited a dark coloration; these cores smelled strongly of hydrocarbons and the water overlying the cores contained a thin rainbow sheen of oil. These cores were not from known hydrocarbon seeps…this oil had not seeped into the sediments from below, it had rained down onto the sediments from above. The animals, worms and such, living in the sediment had been suffocated. These cores were like nothing any of us had ever seen. ECOGIG scientists were the first to document the phenomenon of “weathered oil sedimentation” in the wake of an offshore deepwater oil spill.
image below: Photograph of a sediment core collected 10 km NE of the Macondo wellhead. The dark caramel colored layer on the top of the core is "weathered oil snow" that had freshly sedimented to the seafloor. Right image: Close up of the sediment surface of one of these cores, showing web-like mucous stringers and dead infauna. (Photo credit: Mandy Joye)
Discovering cold water coral damage
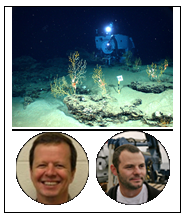
Cold water corals were an unanticipated victim of weathered oil fallout. ECOGIG co-PIs Dr. Chuck Fisher and Erik Cordes were the first to document DWH-linked damage to cold water coral communities.
Dr. Erik Cordes: There was a pre-scheduled cruise of the NOAA Ship Ron Brown with the ROV Jason-II from Woods Hole Oceanographic Institution from 14 October – 4 November, 2010, that was part of the co-funded MMS – NOAA/OER Lophelia II study. We spent the majority of the cruise carrying out the core work of this funded research program, but the Deepwater Horizon was in the backs of our minds the entire time. We had been out to sea for weeks looking at all manner of healthy deep-water coral communities spanning the entire Gulf of Mexico. So, when we arrived at the Mississippi Canyon 294 site towards the end of the cruise, it was immediately clear that there was something wrong. There were numerous octocoral sea-fans that were covered in a black flocculent material; the mysterious “floc.” These corals looked very unhealthy, exhibiting the characteristic coral stress response of releasing mucous, and at other parts of the skeleton, there was tissue coming off, literally skin peeling from the bone. When we recognized the problem, we immediately stopped the work that the ROV was doing, and began the careful photographic survey that would become the core of our damage assessment work. After returning home, our upcoming NSF RAPID cruise was quickly re-tasked to revisit the site. When we returned the next month, from 10-17 December on the R/V Atlantis with the deep submergence vessel Alvin, we were prepared to do the careful sampling required to understand which species had been affected, to determine the composition of the “floc”, and to take careful photographs of every coral that we could find. The floc turned out to contain hydrocarbons were traced back the Macondo well. The floc also contained residues of the dispersant applied at depth for the first time in history, but also at the surface in huge volumes. We also visited a second site to determine if there had been more widespread impacts. Later cruises further confirmed that there had been impacts to a number of sites in the area surrounding the well-head, up to 22 km away and from 1300 to over 1900 m depth. It will take years to fully understand the extent of the damage in this remote and still unexplored area, and to determine how long these injured corals will take to fully recover.



 back to top